
Do you know every missing data piece can turn into an excellent insight required for efficient decision-making?
Staying ahead of the competition requires being equipped with valuable insights and updates. But businesses collect a large amount of data regularly which can be hard to analyze.
A data analytics platform like Google Analytics helps extract and present the collected data. However, business intelligence platforms like Power BI help identify hidden information from the accumulated data.
Connecting Google Analytics to Power BI makes the entire data collection, visualization, and analysis process convenient. Let’s start by understanding the meaning and working of the two data-oriented platforms.
What is Power BI?
Power BI is a data analytics and visualization platform helping organizations make better decisions. Microsoft launched this cloud service with a heavy focus on business intelligence (BI).
The platform provides up-to-the-minute analytics required for updated decision-making with hundreds of data visualizations, integrations, and custom data connectors. It prioritizes organizations’ safety with end-to-end encryption and real-time access monitoring. Furthermore, it consists of highly specific tools helping companies receive deeper insights into the extracted data.

Benefits of using Power BI
Here are some key benefits of using Power BI:
- Helps create personalized reports based on your business’ KPIs.
- Get quicker AI-powered answers to your queries, even with a conversational tone.
- Easy collaboration of multiple departments for data analysis and decision-making.
- Strategic data-driven decisions at every level enhance the overall organizational performance.
- Help make the most of your investment when used with platforms like Google Analytics.
- Equipped with more than 500 free connectors for making data-driven decisions.
What is Google Analytics?
Google Analytics is a free-to-use data analytics platform providing valuable insights at every customer journey stage. Most companies use GA with Google Adwords to get the most return out of their advertising efforts. It helps understand how customers interact with your website and gives a clearer picture of your ideal customer persona. Most users trust Google Analytics for interpreting data-oriented results.
The platform also allows creating and measuring custom goals specific to your business. Furthermore, it ensures you measure performance across various channels and devices for an accurate comparison.

Create a plethora of reports using GA
GA helps users generate many different reports falling into categories like Audience, Acquisition, Behavior, Conversions, and real-time. One of the most loved features of the platform is the option to create custom reports. You can then build a report from scratch or use the standardized GA template based on your specific needs.
What can Google Analytics track?
Google Analytics can be used to track the following core website aspects:
- Search Engine Optimization (SEO) to understand the content bringing organic traffic.
- Identify your top-performing blog posts to create relevant content.
- Focus on the ad copies and landing pages driving the most conversions.
- Go through the eCommerce funnel to understand the various stages leading to buying decisions.
- Keep track of the website traffic and social interactions based on your PR efforts.
How to leverage GA with Power BI?
Data consumption has been growing tremendously in the last couple of years. As a result, companies keep finding ways to manage the accumulated data in a structured manner.
With a heavy increase in competition and a race for enhanced product quality, the importance of data-driven decisions is at an all-time high. However, extracting, managing, and analyzing vast chunks of data daily becomes troublesome for most businesses.
Businesses often remain paranoid about missing meaningful data chunks required to dominate competitors. This equation relies on the following parts:
- Tracking website and app user data
- Extracting website and app user data
- Analyzing the aggregated data.
Google Analytics works exceptionally well in extracting app and website data from multiple sources. However, businesses must rely on versatile tools like Power BI to analyze complex aggregated data.
Power BI is equipped with many tools for accurate analysis and data presentation. Therefore, you can conduct data extraction, analysis, and reporting processes by connecting Google Analytics with Power BI.
Why connect Google Analytics to Power BI?
Google Analytics (GA) remains highly effective in extracting and analyzing data. Then why connect GA with Power BI?
GA works well in extracting data, monitoring user behavior, tracking website traffic, etc. However, it doesn’t connect with other sources which is needed to make insightful decisions.
Connecting Google Analytics to Power BI (Step-by-Step Guide)
Connecting GA with Power BI is an easy process that immediately depicts your sight insights in the last six months. There are following two defined ways of connecting Google Analytics to Power BI:
- Connecting GA To Power BI Desktop
You can easily connect GA with Power BI using the Google Analytics connector. You can conveniently monitor real-time data post-connection. Here are the steps to initiate the process:
Step-1: Power BI configuration
Start by launching the Power BI desktop on your system. Select the Get Data option in the home bar. From the following panel, choose the online services option. You’ll come across a variety of services required to introduce data into your system.

You will come across a list of available services, including Azure, Adobe Analytics, GitHub, etc. Select Google Analytics from the list and click on Connect.
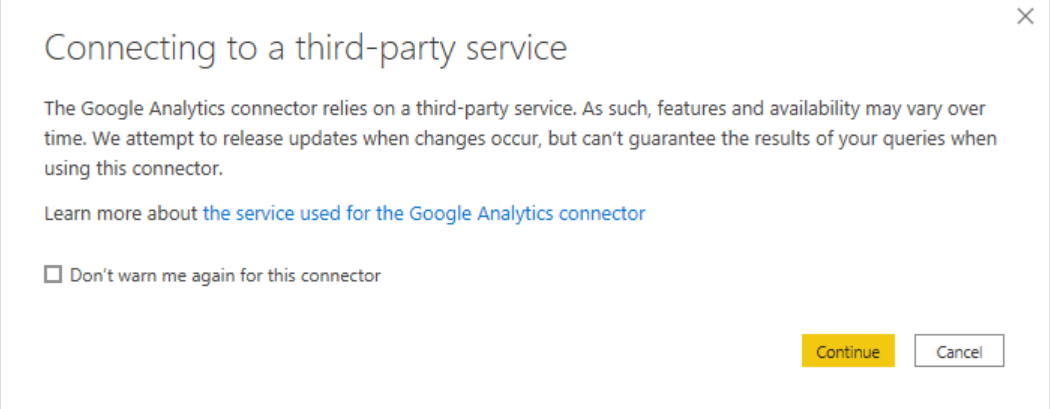
The connection process will begin and another menu will appear. It gives instructions regarding connection to a third-party service. Go through them thoroughly and click on Continue.
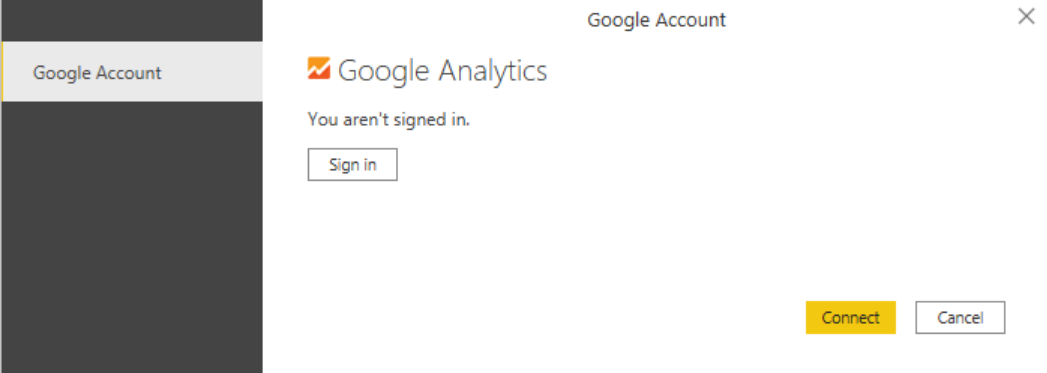
Step 2: Sign in to GA
Insert your username and password to sign into your Google Analytics account. It allows Power BI to connect and access your analytics data.
Next, give access permission by clicking on Accept to successfully allow a Power BI connection with your GA account.
You will successfully establish the required connection to access the two tools together. Initiate your data visualization and analysis process post connecting Google Analytics to Power BI desktop.
- Connecting GA to Power BI Service
As discussed above, you can successfully establish a desktop application of Google Analytics to Power BI. However, Microsoft also introduced a Power BI SaaS application for users. Here’s how you can connect the SaaS application with your GA account.
Step-1: Sign in to your Power BI account
Open the Power BI website to sign in to your account. After successfully signing up, select apps from the navigation column.
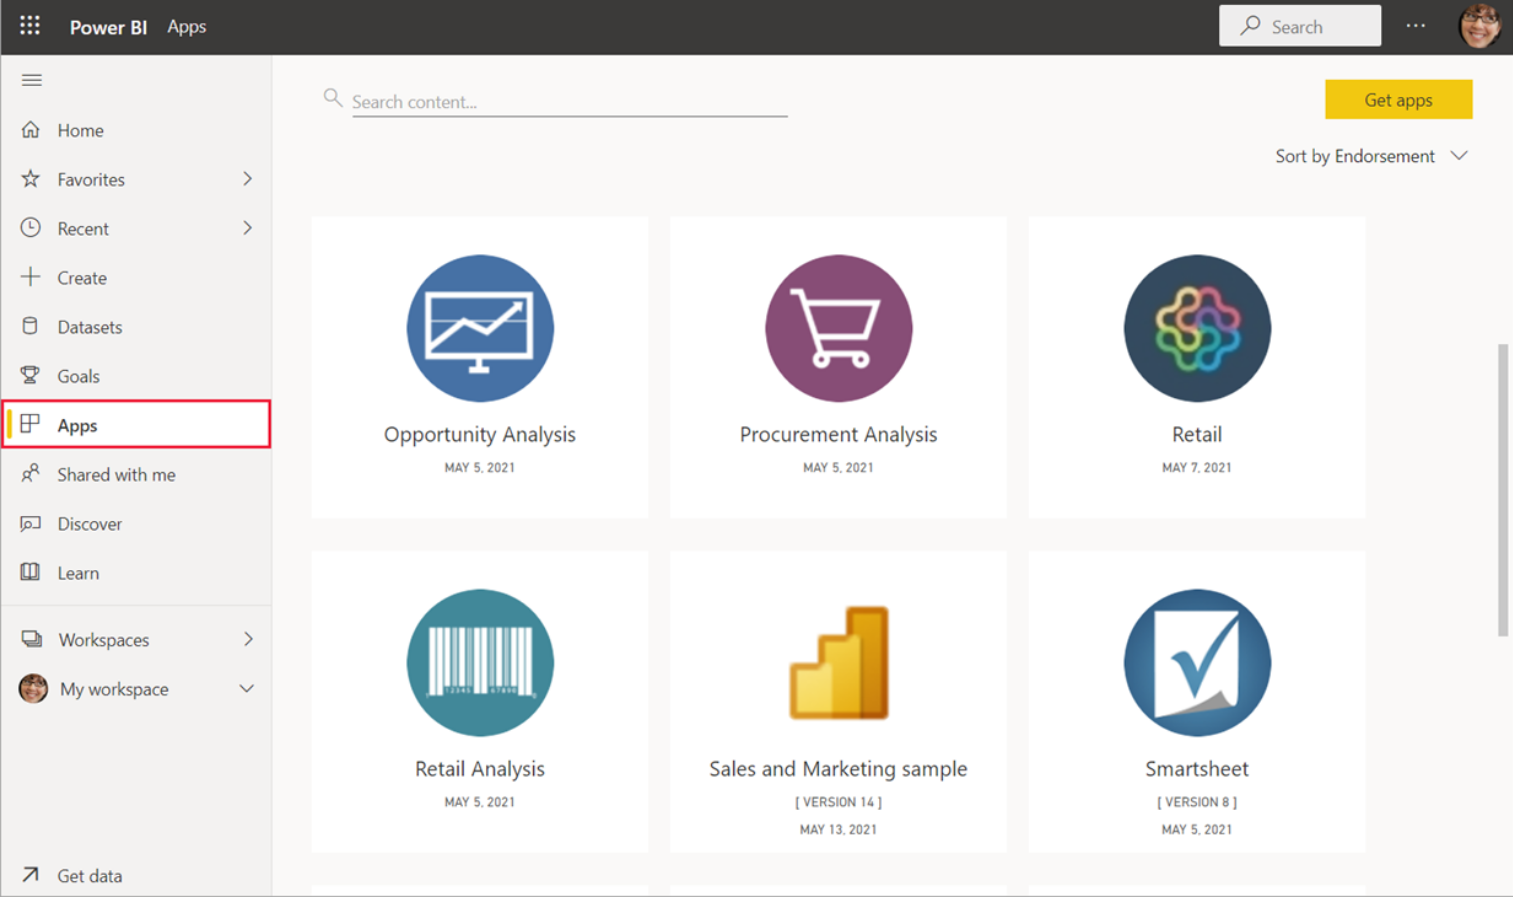
Choose the Get Apps option to open the app source window.

Here you will find many different services you can connect with including Google Analytics. Click on Google Analytics from the available options.
Step 2: Establishing a connection with Google Analytics
Go through the dialogue box showing you Google Analytics’ overview and reviews. Simply select the Get It Now button to establish a connection with GA. It will then redirect you to the sign-in page. Complete the sign-in process to start data importing.
Limitations of connecting GA with Power BI
Some issues users often come across while connecting Google Analytics with Power BI are as follows:
- Automatic data sampling by Google Analytics for high-traffic web pages often results in faulty value depiction. It happens because Power BI doesn’t permit checking whether the dataset was sampled.
- Automatic aggregation often creates averages with no possible values.
- Various restrictions on dimension and metric values post connection.
Visualizing Google Analytics data with Power BI
Understanding the time spent by visitors on your website, the reasons they leave, and the days they are most active are all crucial factors for decision-making. Google Analytics works excellently in acquiring all this insightful data. But connecting it with Power BI help visualize and explore the accumulated data. Users enjoy immediate access to relevant data insights post-connection.
Here is how you can visualize Google Analytics data with Power BI:
- Connect directly with a Power BI designer to create custom business reports.
- Easily connect and extract data from other sources to establish a centralized data platform.
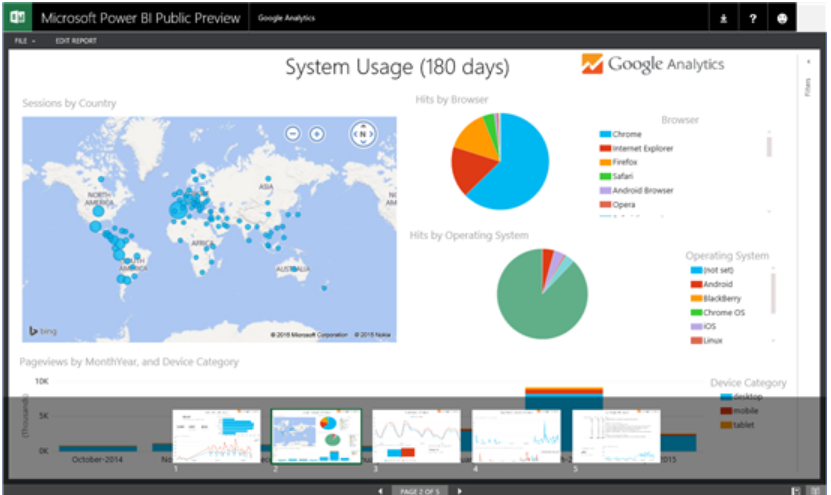
Are you wondering what the final dashboard will look like?
Here is an example of a dashboard presented after connecting Google Analytics with Power BI.

Your data import process begins right after connecting. You’ll receive a notification once your dashboard is ready. After tile selection, you will come across a 5-page report presented in visually compelling slides.
But what about the questions drilling into your mind post-connection? The platform has got you covered with a Q&A section to explore your data and ask questions.
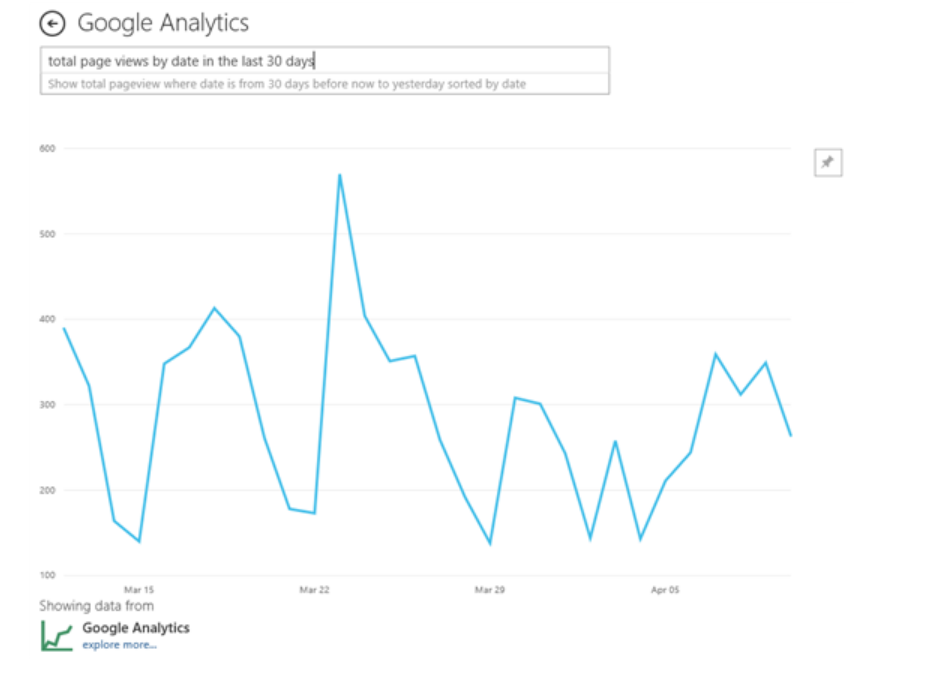
You can collect relevant information like the number of page viewers on a tablet or mobile device. Such key questions often help in creating a better interface and delivering a great customer experience.
Next comes collecting non-website-related data from other tools. For example, you are running your email campaigns using Sendinblue. You can acquire the specific data sets and display your campaign results next to them.
Generating custom reports using Power BI designer
Let’s now talk about building your custom reports post-connection. Power BI is designed to specializes in helping users generate insightful custom reports suiting their requirements.
Here is how you can successfully build your custom reports:
- Start by downloading the latest version of Power BI designer.
- Click on Get Data and select Other Sources
- Select Google Analytics from the available options

- The connector helps accumulate all Google Analytics data.
- Insert your credentials toand give allow Power BI to get access to your account.
- A list of account access will display in front of you. You will find a list of different values to scroll through.
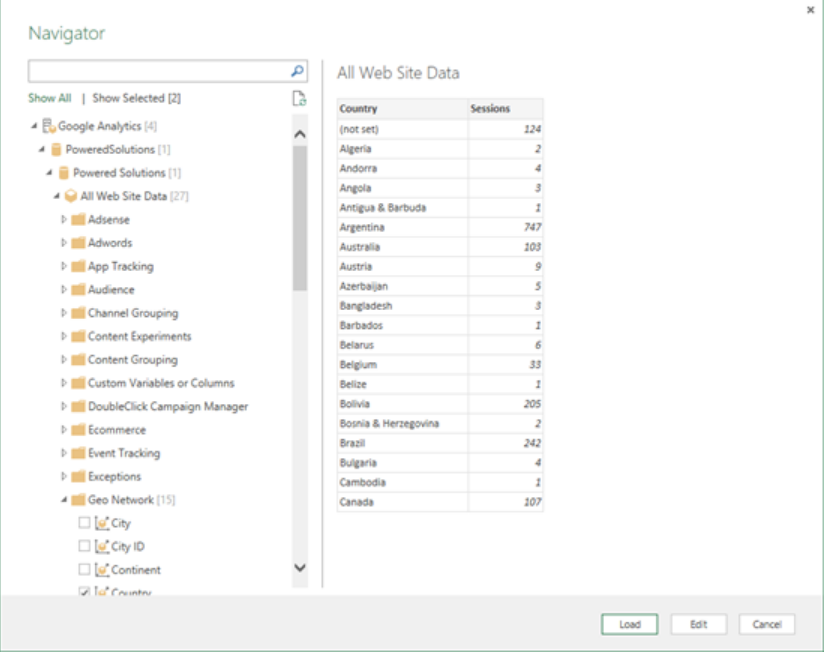
- Power BI will acquire the result for selected values by sending queries.
- You will come across a table consisting of the selected values. Based on Google Analytics value section restriction, choose your initial set and start building.
- Go through the available filters to sort data according to important variables like time or date.
- Click on the Report view to start visualizing your selected data.

You’ll come across a custom-generated report consisting of all crucial metrics. Adjust your selected values to modify your reports based on the changing requirements.
Conclusion
Connecting Google Analytics to Power BI can give you an exceptional edge over the competition. Follow the process immediately if you are tired of not receiving results over your data-oriented actions. It will help you get access to all valuable insights, irrespective of the sources you use. Furthermore, play along with your data based on your requirements with the Power BI designer.