
Marketers are always looking out for alternatives when it comes to making decisions that impact or influence business growth and brand awareness. The parameters for these decisions are mostly accompanied by typical queries, such as which keywords are performing well or receiving high search traffic, which ads are top-performing, or calculating the Cost Per Action (CPA), and insight from impressions of a campaign.
Marketing campaigns are organized to attract new customers, promote brand awareness, and improve sales. Companies are largely using online channels for their Advertising activities and Google Ads is the most popular platform.
In this blog post, we will discuss how to connect Google Ads to Google Data Studio. Google Data Studio is a free online data visualization tool that helps you create data-driven reports and interactive dashboards. The dashboard will show and analyze data generated during your Google Ads campaigns, to understand your market segment better and optimize your marketing efforts.
5 Easy Steps to Build Google Ads Dashboard
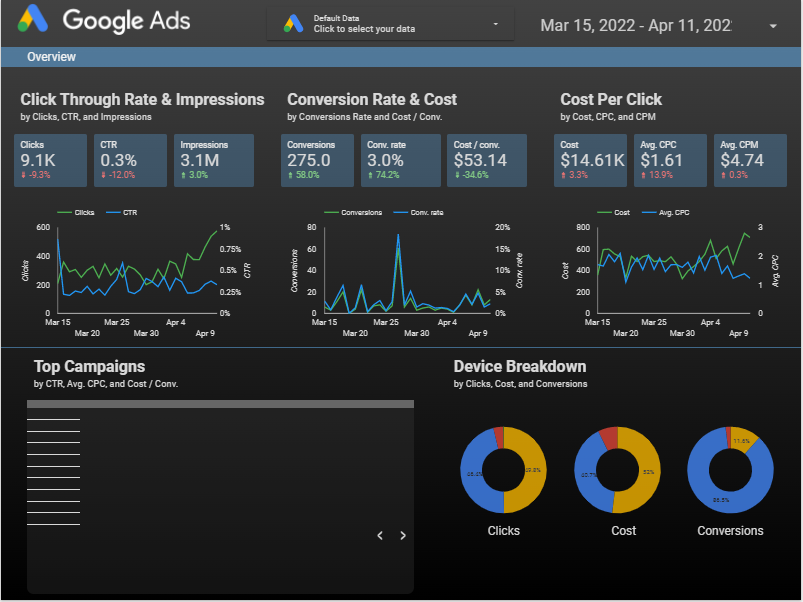
Below is an example of what the Google Ad dashboard looks like. Scroll down to read the steps required to make it and the finished report at the end of this blog post.
Step 1: Choose Google Ads as Your Data Source
- Login to your Data Studio account
- Create a new data source
- Select Google Ads as the data source.
In this example, we are using the Google Ads sample data as our data source. You can choose any Google Ads Data Studio templates from the gallery.

Step 2: Build Scorecards with various metrics
The above report has various scorecards with some metrics. We will discuss the ones displayed in this report. The definitions are taken from the Google Ads Glossary.
Impressions: How often your ad is shown. An impression is counted each time your ad is shown on a search result page or other sites on the Google Network.
Clicks: When someone clicks your ad, like on the blue headline or phone number of a text ad, Google Ads counts that as a click.
Conversions: A specific customer action that you’ve defined as valuable to your business, such as an online purchase or phone call.
Clickthrough rate (CTR): A ratio showing how often people who see your ad or free product listing end up clicking it. Clickthrough rate (CTR) can be used to gauge how well your keywords and ads, and free listings, are performing.
CPC: Cost-per-click (CPC) bidding means that you pay for each click on your ads. For CPC bidding campaigns, you set a maximum cost-per-click bid – or simply “max. CPC” – that’s the highest amount that you’re willing to pay for a click on your ad.
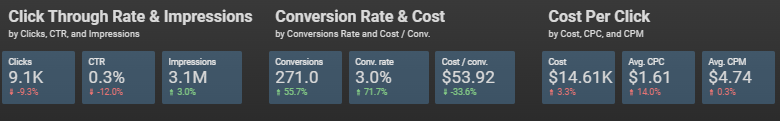
These scorecards can be easily accessible from the Chart section, we are using a single metric which we will compare to a previous period.
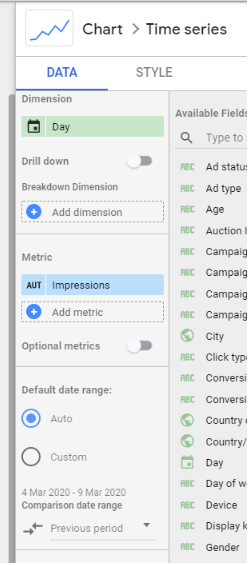
Step 3: Build Time Series line charts
Let’s see how these time series line charts are shown below:
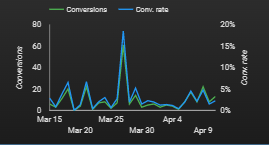
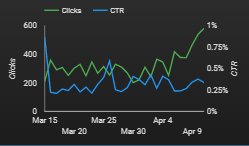
You can create these line reports by setting up the Dimension* as Day, the Metric* can be either clicks, CTR, or Impressions and must have a data range of the previous period.
*Dimension – A set of values by which you can group your data – typically names, descriptions or other characteristics of that data.
*Metrics – Metrics measure your dimensions. A metric is the result of applying an aggregation to a set of values.
Step 4: Build a Pie Chart showing Clicks, Costs, and Conversions
The final part of your report focuses on creating a table or pie chart that shows clicks, costs, conversions, and impressions.
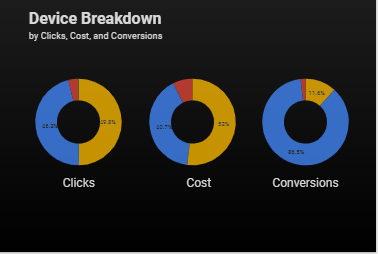
You can also show how these metrics have changed compared to the previous period. You can drill down into more metrics like campaign dimensions such as Ad group, campaign type, and Ad type.
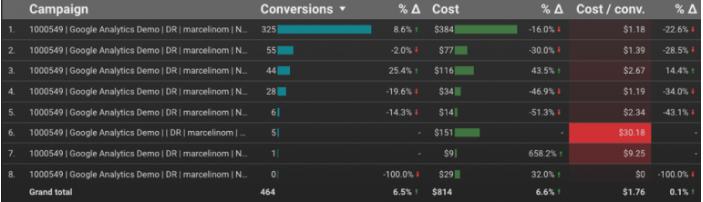
Step 5: Now Check the Google Ads Dashboard
If we dig a little deeper and switch some of the optional metrics, we can see the table looks as shown below. This allows you to customize the data the way you like without adding any additional tables or charts.
Conclusion
You have learned the importance of data analysis and how it can guide an online campaign to achieve its desired goals. You were introduced to Google Data Studio and how the data visualization and reporting control helps to make informed decisions. Having an instant dashboard in place, you can have access to performance goals and actuals which gives you insights to be more strategic in your ad spend and marketing decisions.
With this Google Ads dashboard, you’ll be able to meet the demands of your marketing goals and drive better management decisions for your stakeholders.
Related Resources
- How to Build a Google Ads Dashboard in Google Data Studio
- Guide to Google Analytics Channels Medium and Source
- How to Create a Custom Dimension in Google Data Studio
- Create Your First Google Data Studio Report in 5 Easy Steps
- 6 Easy Steps to Connect Hubspot to Google Data Studio
- Ultimate Guide to Google Data Studio