
What is Google Data Studio?
Google Data Studio is a free data reporting and visualization tool. It has the capacity to turn your data into informative, easy to read, easy to share, and customizable dashboards and reports. The data can be beautifully displayed using a set of charts, graphs, tables, and other visualization elements.
You can pull data from Google Adwords, Google Analytics, Google Search Console, and other Google products. These are known as connectors. In addition to the connectors, you can also pull data from third-party connectors such as Bing Ads, LinkedIn, Twitter, Facebook Ads, and more.
Moreover, Google Data Studio Reports allow you to create reports and share them with your team members, managers, and individuals without downloading any files. It also supports sharing through links, emails, and scheduled sharing.
Simple Steps to Build Your First Report in Google data Studio
For this tutorial, we are going to build a simple website overview Google Data Studio dashboard. We will be using a Google Analytics demo account which is available free on Google.
This tutorial will be broken out into 5 simple steps to create a Google Data Studio dashboard.
Creating A Data Studio Account
If you are using Google Data Studio for the first time, you need to create an account.
Go to datastudio.google.com and click START FOR FREE.

Now, log in using your Google account and follow the steps to create your free account with Data Studio.
The Main User Interface
There are two main components in Data Studio; Reports and Data sources. From the home page, you can access all reports or data sources you have created so far. Additionally, in the Reports tab, you can click Template Gallery to find a list of pre-made templates to get started with or start with a Blank Report.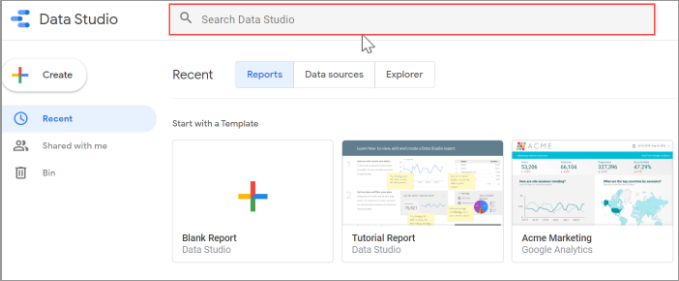
Step 1 – Creating A New Report
Now, click on the “Create” menu option available in the upper left corner of the window.

Click on “Report”

Step 2 – Add First Data Source to Your Report

We should select a data connector from the list given on the platform and connect it to our pre-existing data set to make that data available in our report. As discussed earlier, we begin with Google Analytics. After selecting “Google Analytics” we have to authorize adding the data.

The next stage to adding the data source is to click “Add to Report”.

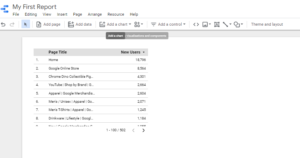
Step 3 – Google Data Studio’s Editing Interface
As we have connected our report to the data source, our interface looks like the below.
Note: We are using Google Analytics Demo Account for the report.

In the middle, you can see the blank workspace that is called the Report Canvas
Now that we are done with the data source setup, let’s begin to create our visualizations.
In the top menu bar, you will find all the visualization options that you can add to your report. These include:
- Time Series graphs
- Pie Charts
- Bar Charts
- Scorecards
- Tables
- Maps
Let’s add a chart to the current report:
Add a chart > Scoreboard

We added a Bar Chart, a Time Series Chart, a Pie Chart, and a Time Series Chart.

Step 4 – Customize the widget
You can change dimensions or metrics to show exactly the data you need. There are several other options you can change in the Time Series Properties, and get exactly what you need in the graph for your project.
For this example, you want to look for a periodic comparison period to the graph. The previous data you have created will show as an additional line in the graph. This allows you to compare the current data to the previous period.
Step 5 – Sharing Data Studio Reports
Just the way you share Google Docs or Google Sheets, here you will click the Share button and we can easily share the report with other people by entering their email addresses.

You can also click Manage Access to create a link to the report. In both cases, we can set the access to View and Edit as well.
That’s it! Starting with Google Data Studio is not hard and it allows you to have fun while creating a project for your organization. Do you have any questions? Feel free to share your queries in the comments section of this article, our experts will get back to you at the earliest.
Related Resources
- How to Build a Google Ads Dashboard in Google Data Studio
- Guide to Google Analytics Channels Medium and Source
- How to Create a Custom Dimension in Google Data Studio
- Create Your First Google Data Studio Report in 5 Easy Steps
- 6 Easy Steps to Connect Hubspot to Google Data Studio
- Ultimate Guide to Google Data Studio