
Data is the backbone of marketing. With the right data, you can make more informed decisions. It can show you what types of customers are most profitable, where to focus your ad spend, and so much more.
However, data is only numbers. You need to understand what it means to make the most of your data.
That is where Google Data Studio comes in. You might have already used Google Analytics, which gathers the data and offers a limited display. Google’s Data Studio helps you understand what your collected data means for your business. Let’s dig deeper –
What is Google Data Studio?
Google Data Studio is a free online data visualization tool that helps you create data-driven reports and interactive dashboards. The dashboards are visually appealing, easy to share across the web, and fully customizable, allowing you to bring your data to life and help you tell a story.
Google Data Studio helps you accomplish three critical jobs:
- Connecting data into a single presentation
- Visualizing data creatively and dynamically to help make a decision
- Sharing that data with your team members, clients, and stakeholders – that too, presenting data in a clear, compelling way.
How to Get Started With Google Data Studio?
The first step is to log in to Google Data Studio with your Google account to access the platform. Below, we’ll walk through the platform, how to create a report, add data, and generate your first report.
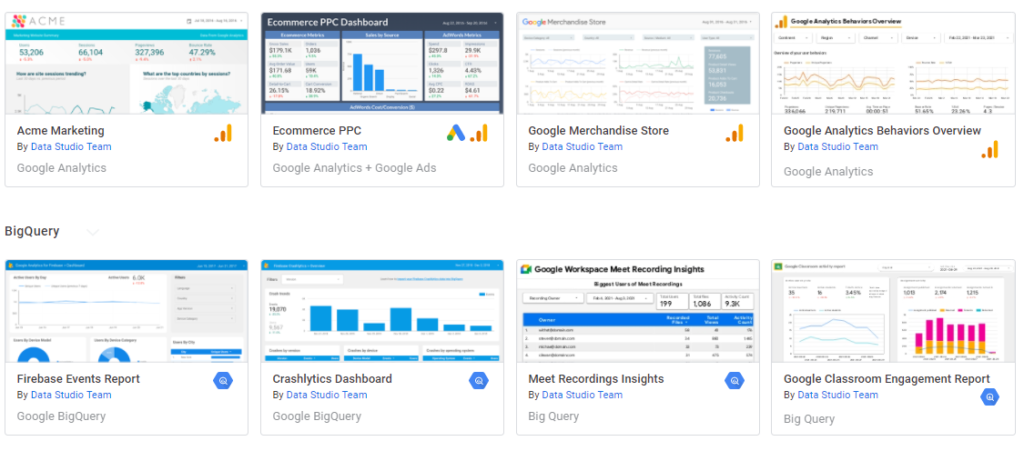
Step 1 – Choose a Template for Your Report from Template Library
There are two ways to create a report. You can either create a blank report or use one of the templates from an already existing template gallery. If you’re not sure where to start with Data Studio, we recommend browsing through their templates for inspiration. Many templates are pre-built by the Data Studio team; you can see them all in the “Marketing Templates” section.
With any template, you can customize items and fonts to create a consistent report. As we all know, every client has different needs, and their reporting should be no different. As an agency, we found a more efficient route to create templates specific to SEO, PPC, and paid social.
Step 2 – Add Data Sources to Google Data Studio
Now, what are Data Sources? Simply put, data sources list all the connections you’ve created between your original data sources and Data Studio. When you link the connectors, it does the manual tasks and syncs all data for you. Anytime, you can choose to add data sources at the beginning of your report, or add them later on.
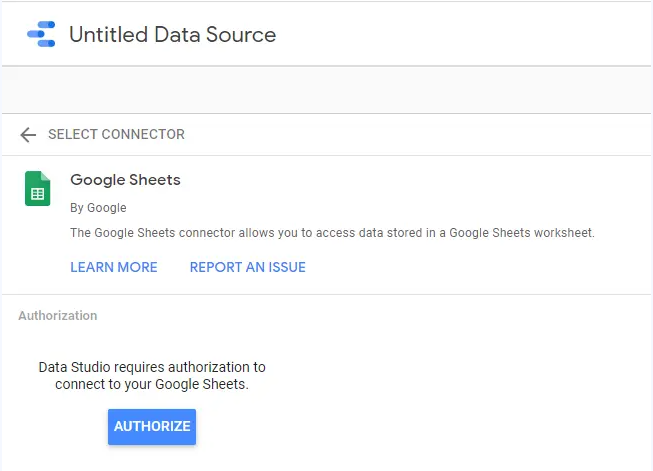
Let’s connect to your data sources by clicking on the “Add Data” button in the menu bar, and choosing where you want your data to come from.
In the example below, we have selected Google Sheets for fetching data automatically. Once you click Authorize, Google Data Studio connects with the properties linked to your Google Account. Then, you can pick which spreadsheets should be collected to prepare the report.
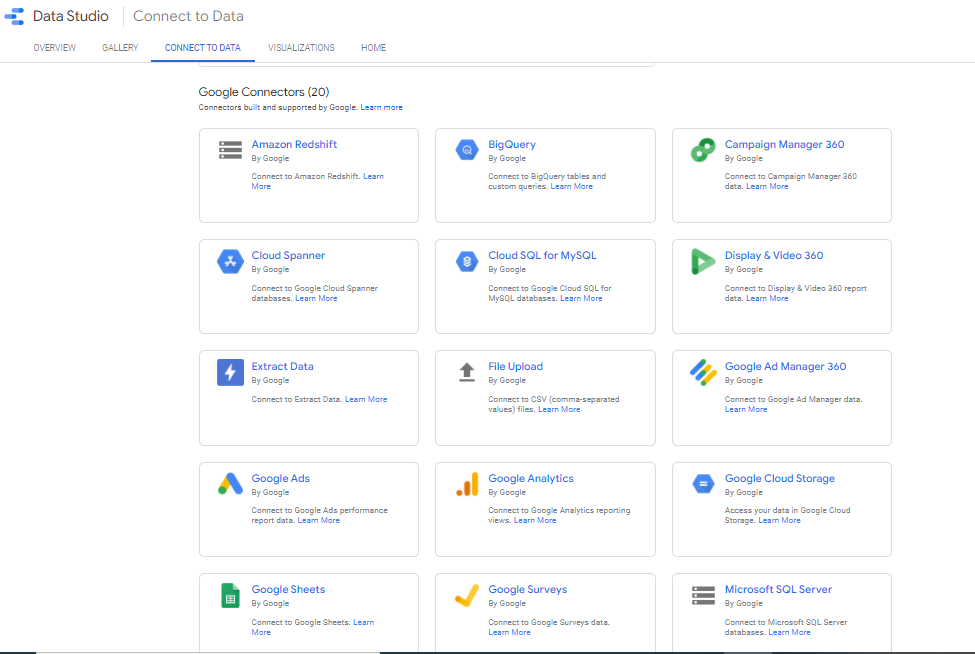
You can also add data from other sources, including (but not limited to): Google Sheets, Google Ads, BigQuery, Campaign Manager 360, Google Survey, AdRoll, Facebook Ads
YouTube Analytics, PostgreSQL, CallRail, Ahrefs, Campaign Monitor, and more.
Now, you can select the account, website data, and the property you want to add, then click Add.
View all data sources available here.
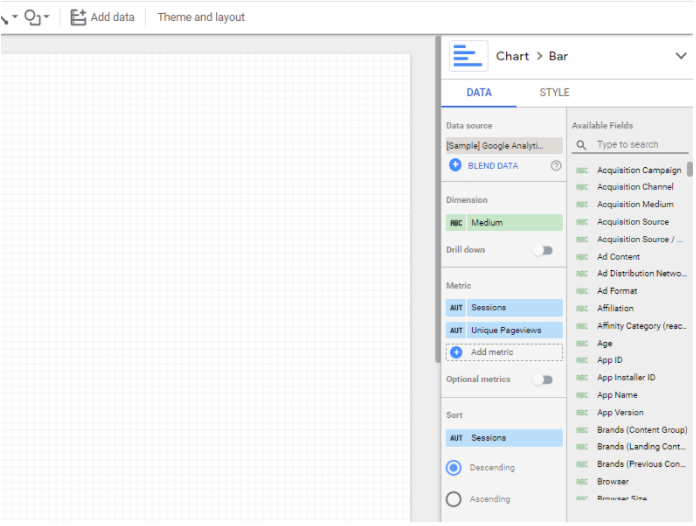
Step 3 – Customize the Report Visualization
Now that you have connected your data resources, Google Studio will display a similar page to the one below. From there, you can add logos, icons, images, and shapes, change color, and edit properties according to your goals and branding.
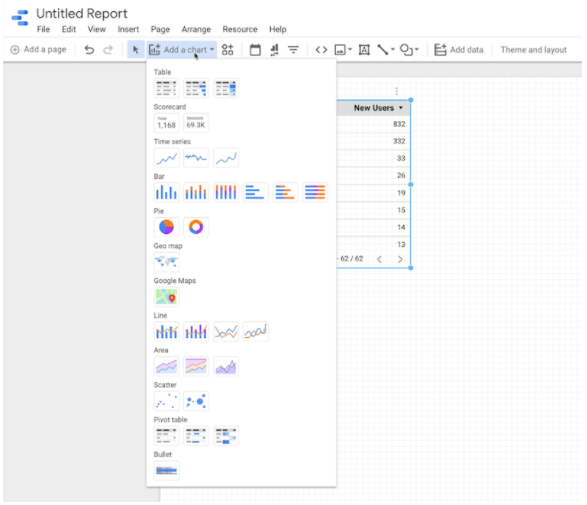
Once you are done with the chart type, you will see the right-hand pane appear. You can simply drag and drop the dimensions from the “Available Fields”.
If you pick an existing template, the report will already look more complete – you need to edit the data and customize it as you wish.
Step 4 – Share Your Report
Lastly, when you are done with your report, Google Data Studio allows you to share data and reports. You can invite your team members, and external resources to view or edit the dashboards, according to the level of access you’ve defined.
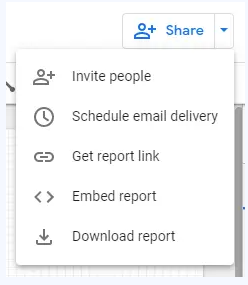
Google Data Studio allows you to –
- Invite people to view the report,
- Schedule an email delivery,
- Invite your clients and share the dashboard, embed the report, get a link, or
- Just download the report.
Benefits of Google Data Studio
Google Data Studio is so great, but why? When using it, you have access to the following key features:
Google Data Studio is FREE! It’s a free tool that is available for anyone to use.
Customizable Dashboards
Google Data Studio allows users to create custom reports with a wide range of styles, designs, graphs, and formatting. If you are familiar with Google Sheets, you can easily customize your report with pre-existing features available in the dashboard.
Version Control
Google introduced Report Publishing in Data Studio. It brings version control to this popular cloud dashboard. The feature allows contributors to know they can work with the latest information without cutting off access to the latest version for readers.
Live data connection and access to over 220 connectors
The platform has built-in connections to over 200+ data sources which eliminate the need to schedule periodic data refreshes for your report.
Control over customization of reports and visuals
Data Studio lets you add numerous pages, charts, and tables as needed. You can customize your dashboards with your brand colors, even your clients’.
Data Studio is not a data source like Google Analytics or HubSpot. It doesn’t collect the data; rather, it combines your data from different sources, puts it into a presentable manner, analyzes it, and then lets you create interactive charts, reports, and dashboards.
Dynamic controls with report and page level filters – With Data Studio, you can have the ability to slice and dice the data without having to update the report setup itself. You can insert dynamic controls to your viewers so that they can filter through the content with date range selectors. You can also include and exclude content/date from a filter if you don’t want all the content on the page to change.
Google Data Studio FAQs
Q. What are data platforms?
As we discussed earlier, you can bring data from Google-owned sources into Data Studio, including Search Console, YouTube, Google Ads, and Campaign Manager.
There are also more than 540+ partner connectors – third-party bridges between Data Studio and platforms like Adobe Analytics, Asana, AdRoll, Amazon Ads, AdStage, and more.
Check out all the options here.
Q. What is a visualization platform?
Data visualization is the graphical representation of structured information or data. It helps you see and understand trends, patterns, and outliers in data by using visual elements like graphs, charts, maps, and more. The best data visualization tools include Google Data Studio, Looker, Tableau, Grafana, etc.
Q. What are connectors?
After choosing a template for your project, you need to add data to your report. To do that process, you need to drag and drop it from the data sources pane on the left side of the screen.
You can simply use filters and calculated fields to give a better meaning to your data. These data sources are called “Google Connectors” and there are over 20 of them.
Check out all the connectors here.
Q. What are data sources?
Data sources give your unstructured data the schema or structure of the fields you can use to create your reports. In a way, the data source is where you model your data: for example, by adding parameters, creating calculated fields, and adjusting data types.
The best part of Google Data Studio is – that it’s constantly being updated, and new features are added regularly. This means you can always find improved and updated ways to create reports and new channels to add to your list of data sources.
Check out all the data sources here.
Final Thoughts
Now you know Data Studio inside and out. Our guide showed you how to access tools, create your first report, integrate other platforms, and explore the data for better analysis. In today’s data-driven marketing, tools like Google Data Studio are essential for a team’s day-to-day activities and decision-making.
There is so much more that Google Data Studio has to offer, and we suggest you take some time and explore the platform with your team. Also, we recommend checking out gallery templates and reading through what people are discussing at the Data Studio Community.
Happy dashboarding!
Related Resources
- How to Build a Google Ads Dashboard in Google Data Studio
- Guide to Google Analytics Channels Medium and Source
- How to Create a Custom Dimension in Google Data Studio
- Create Your First Google Data Studio Report in 5 Easy Steps
- 6 Easy Steps to Connect Hubspot to Google Data Studio
- Ultimate Guide to Google Data Studio