In the following guide, we will talk about case statements, calculated fields, and how you can use custom dimensions in Google Data Studio.
What are custom dimensions in Google data studio?
Custom dimensions are one of the most important features in Google Data Studio. It allows you to manipulate data and visualize it in charts or tables based on the new groups or values you define. Google offers a variety of functions or formulas that can be used to produce dimensions from any source. It also helps you extract new dimensions that can be applied to your data sets. You can easily categorize your data on Dimensions, such as country, date, age, gender, medium, age group, device category, etc. Whenever you add data in Google Data Studio, the chart gets grouped by that dimension.
What is Google Data Studio Metrics?
To put it simply, a metric is a number. It helps to measure the dimension in some way. For example, ‘Country’ is a dimension that has multiple metrics. It can be associated with many Metrics such as population, number of internet users, literacy rate, per capita income, gender ratio, etc. ‘Date’ is a dimension you can associate with Metrics like the number of new subscribers on that particular date, number of visits to the website, view time, bounce rate, etc.
Google Data Studio Dimensions and Metrics Properties
You will see all the fields have the following mentioned properties by default:
- Name
- Data type
- Default Aggregation
- Description

Name – The name indicates the dimension or Metrics that appear on the box, e.g, Country, PageViews, Year, etc.
Data Type – This field indicates the type of data presented. The data type can be a number, a text, a city, an image, a hyperlink, a URL, etc. Here, you can edit the data type by choosing the drop-down menu.
Default Aggregation – The default aggregation method in the data source when you use any field as metrics to your data.
Description – To describe the field, these annotations are used just next to the default aggregation.

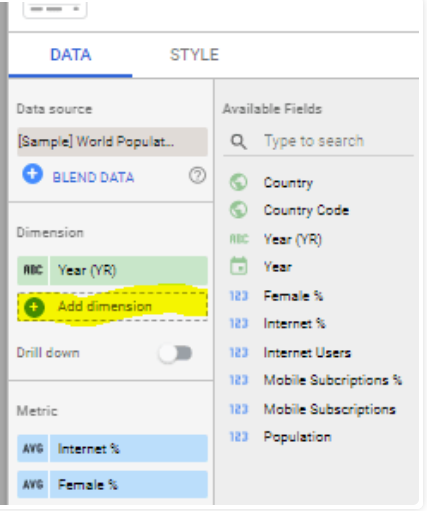
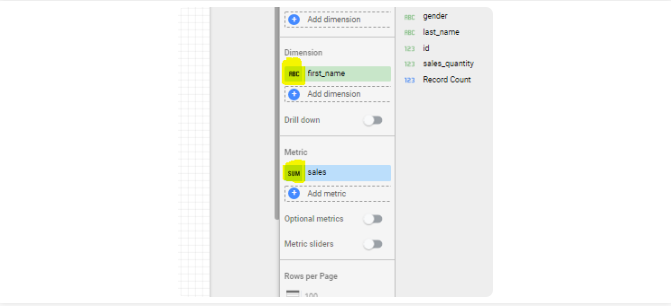
You can change default aggregation in some cases, but not all the time. If the aggregation method is fixed, then you will see the option as Auto. Calculated Fields Being a marketer, comparing data is the most effective way to make informed decisions. In Data Studio you can compare data by creating a new field to present more relevant information using the data that already exists with you. For example, if you have the yearly organization’s sales data, you can create a new field and measure the monthly average by creating a formula. Click on the ‘Add dimension’ symbol on the field and create a calculated field.
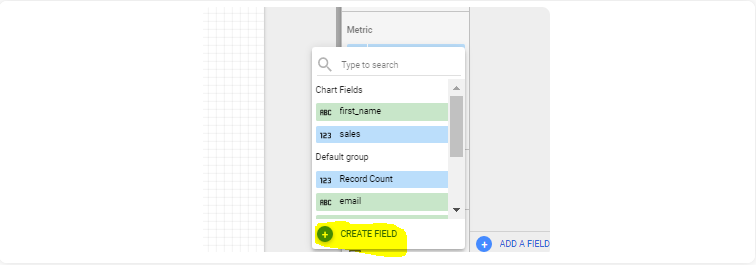
Next, click on the create field option.
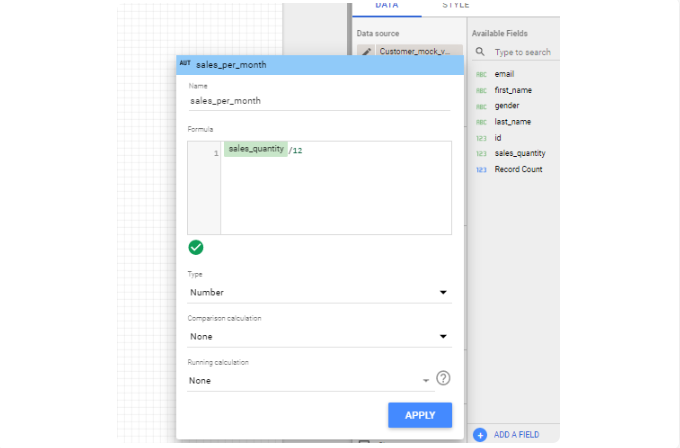
Now, you enter the formula to the existing field to create a calculated field. For example, in the below image, a new calculated field to measure the monthly average is created as ‘sales_per_month’ by dividing the ‘sales_quantity’ by 12.
Calculated fields can be specific to a data source or a chart. You can also create calculated fields using CASE statements with ‘if/then/else’ logic.
How to Create Data Studio Custom Dimensions and Metrics?
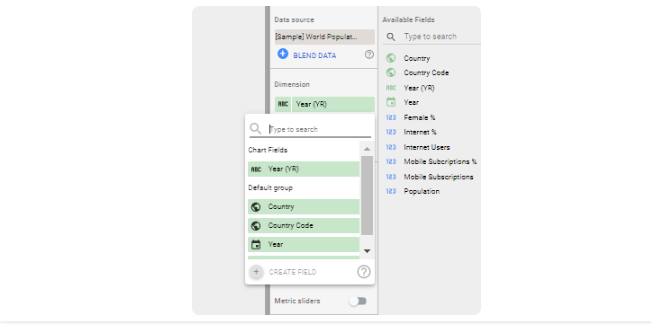
Click on the ‘Add a Dimension’ button in the data panel to add a Dimension to your chart from the data source.
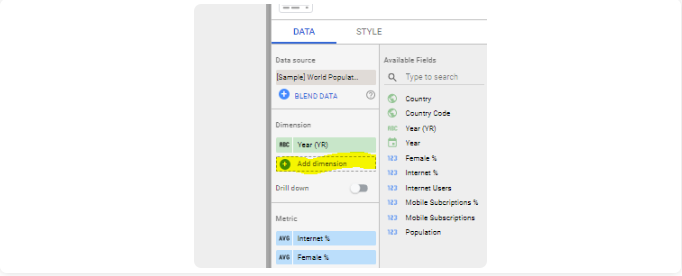
Next, go to the drop-down menu and choose from the options.
The process is similar when you add Metrics as well.

How to Edit Dimensions and Metrics on Google Data Studio? In Data Studio, you can modify the data types, names, aggregations, etc. Click on the chart and go to the data type icon found in the data panel.
You can select the properties you want to modify in the table.
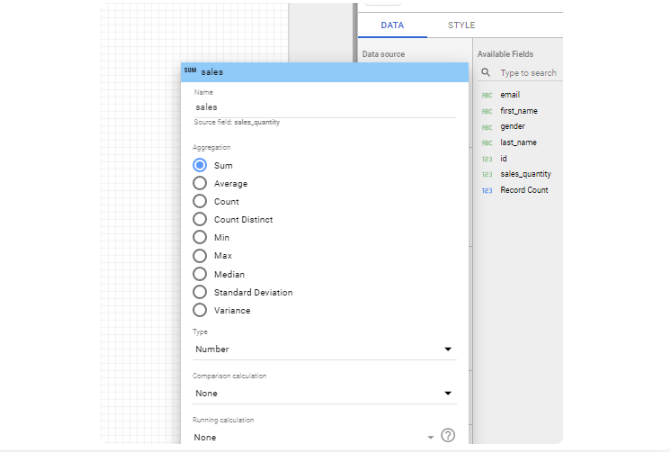
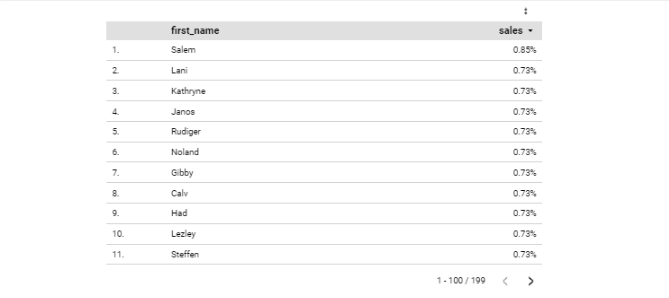
We have already discussed the role of “Name”, “Type”, and “Aggregation”. Now take a look at how comparison and running calculations help you edit the data in the row of the field. Comparison Metrics You can compare data with this option. Compare each row of your data to the total set of data for the field. Apply comparator to a field by clicking on the edit button and selecting the Comparison Metric from the drop-down list.
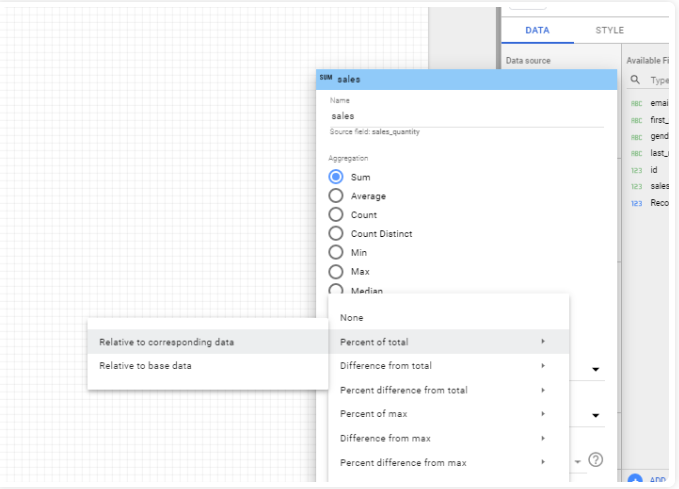
You can see (above screenshot) that the data in the field ‘Sales’ is represented as the percentage of the total. If you refer to the image below, the rows in ‘Sales’ are represented as percentages of the total.
Here is a list of options that you can apply to your table –
- Percent of total
- Percent difference from total
- Difference from total
- Percent of max
- Percent difference from max
- Difference from max
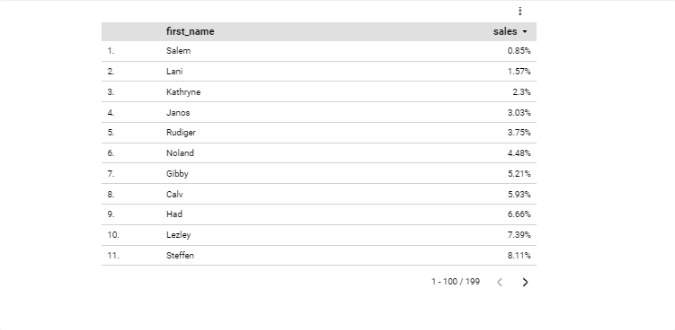
Running Calculation If you want to see the summary statistics for a given set of data for your marketing campaign, Running Calculation helps you see the exact data and changes the dynamics whenever you add new inputs to the table.
Select the “Running Sum”, and you will notice the cumulative values of the rows in the chart.
Here is a list of options that you can select under this drop-down.
- Running min
- Running sum
- Running max
- Running count
- Running delta
- Running average
A Few Notes You can Pull Items with the Custom Dimension If you’ve just set up your custom dimension and wanted to track your published data, it may not look accurate. This system only pulls content from your data if it finds your custom dimension associated with it. So, you may have to stay and gather data before you see the data you want to review. Once You Update Data, It May Look Incomplete Once you update data, you often find not many top content articles have data for 60 and 90-day periods. To skip the manual process of data consolidation, you can check Growth Nirvana, which can integrate all your marketing data and automate everything in real-time.
Related Resources
- How to Build a Google Ads Dashboard in Google Data Studio
- Guide to Google Analytics Channels Medium and Source
- How to Create a Custom Dimension in Google Data Studio
- Create Your First Google Data Studio Report in 5 Easy Steps
- 6 Easy Steps to Connect Hubspot to Google Data Studio
- Ultimate Guide to Google Data Studio