
When Data Studio introduced data blending in 2018, it evolved from an appealing but clunky application to a tool that we recommend to any digital marketer.
Google Data Studio allows your team to communicate data in a simple and repeatable format, with all possible customizations, integrations, and editability that have made the tool extremely powerful.
In this post, we will look at the data blending in Data Studio and see how the functionality helps your business visualize your goal and progress.
What is Data Blending?
Data blending helps you visualize or “blend” your data from two charts, or sources into a single visualized report. Instead of spending on expensive tools, it lets you see two visualized widgets side-by-side. You can merge the data or layer them in Google data Studio to see how they compare.
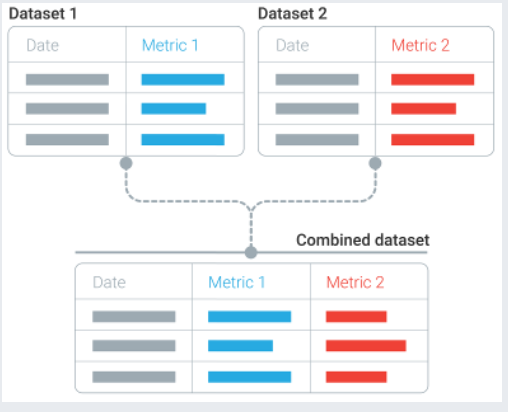
Data studio blend data lets you see and compare two datasets that normally wouldn’t fit together.
For example, if you want to:
- Compare your organic performance vs paid performance in Google
- Check your advertising spend across platforms like – Facebook vs Instagram
For marketers, data blending is vital for saving time and energy.
You can add numerous data sources like Google Analytics, BigQuery, YouTube, Salesforce, and Shopify conversion rates into a single report.
Previously you needed to manually plug your data into a single source and merge the data sets to see the comparison. Now, with data blend, you can showcase data from multiple sources for instant insights – for free.
When do we need Data Blending for your Business?
Typically, businesses accumulate data from different sources. To check how your marketing initiatives perform, you have to have a customized dashboard to get the whole picture of your performance. Data joining helps you:
- Join multiple data sources and give you valuable insights from separate data sources.
- Discover meaningful relationships among data sets.
- Make informed and data-driven decisions.
How Does Data Blending Work in Google Data Studio?
To blend data in Google Data Studio, the data sources need to share a common dimension, known as a “join key”. Your join key could be a product name, page URL, user ID, etc.
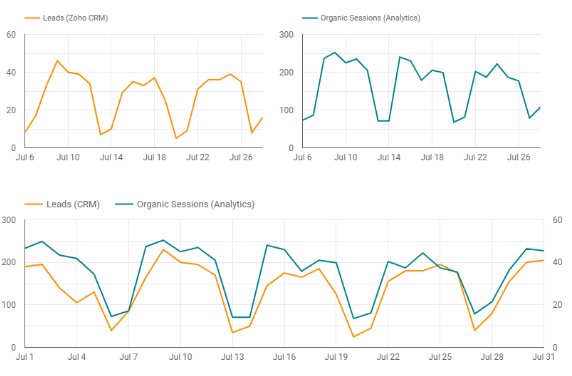
The simplest join key is “Date”. Data analysis largely deals with measuring performance over time, so let’s use that as an example.
Select “Date” as the join key and see how the tool spots correlations in data sets. The dashboard shows you how many leads came into your CRM compared with your organic sessions last month.
Your join key selection is dependent on what you’re trying to illustrate. For example, your hypothesis might be that “your users are more likely to pay via Stripe when they are checking out from a mobile device”.
In this scenario, you would combine your e-commerce platform data with Google Analytics data. So, the transaction ID would be your JOIN KEY.
Set Up Data Blending With Google Data Studio
Follow the steps given below to manage your blended data.
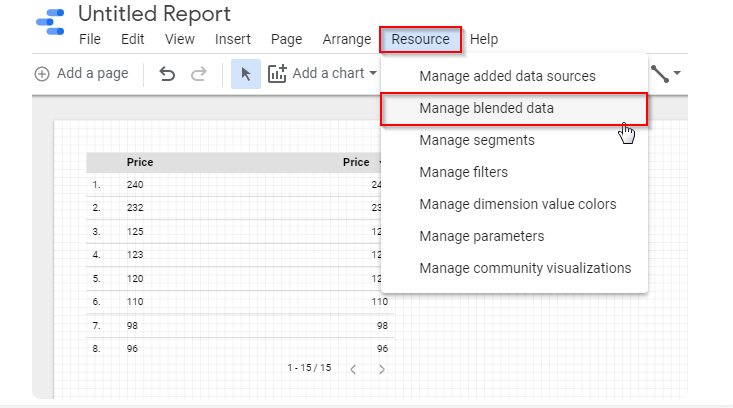
Step 1 – Go to your Data Studio report, and click the “Resources” menu from the menu bar. Choose “Manage Blended Data”.
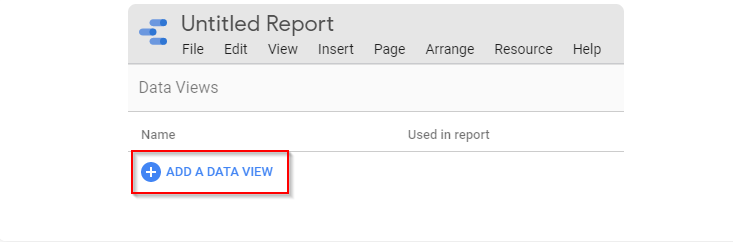
Step 2 – You will be directed to a screen where you can set up a new blend for your project. Click the “Add a data view” button.
Step 3 – Now, you will come to a page where you can add your data sources to the blend. You can always add new data sources or your existing data sources to the Google Data Studio dashboard.
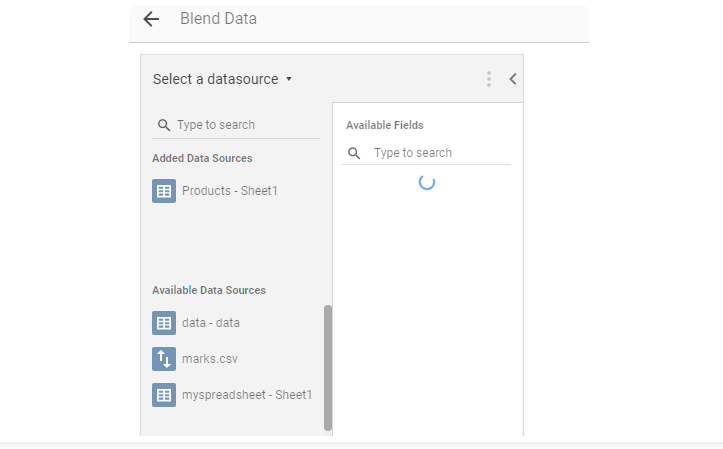
Step 4 – Set up the required metrics and dimensions that you want to have while blending data. Remember, the entire data source will not be blended automatically. As shown below, go to the “Available Fields” and select the “Dimensions” and “Metrics” sections to select the same.
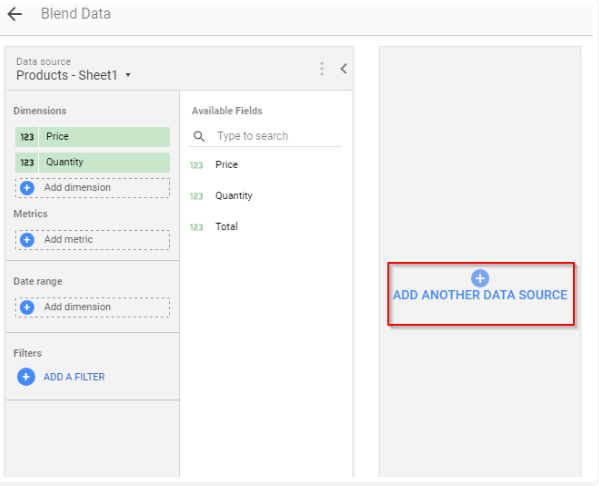
Step 5 – You have added your first set of metrics and dimensions, click the “Add Another Data Source” button to add another source.
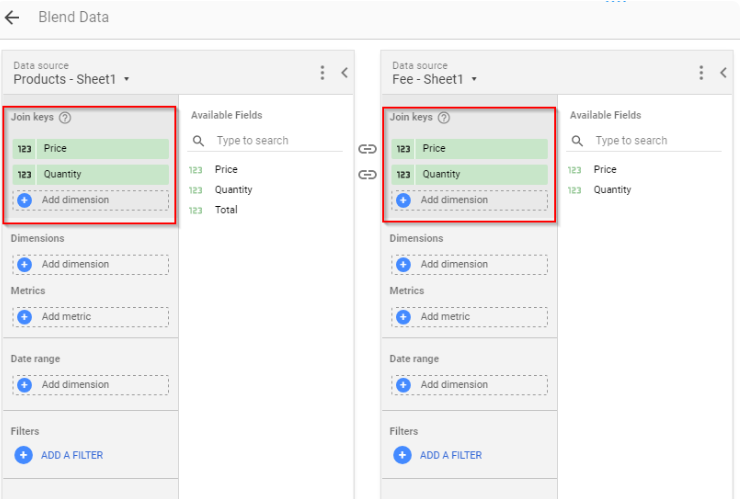
Step 6 – To add the second data source, you will have to follow similar steps to add the metrics and dimensions. You will automatically see a new option showing whether a JOIN key has been detected or not. Either Data Studio will choose a JOIN key for you, but you can edit it if you like.
Step 7 – Finally, give your blended data a name. Review your blending data and hit the “SAVE” button located at the bottom right corner of the screen.
That’s it. You have created your very first blended source.
Limitations of Data Blends
There are a few limitations you might face with the Data Studio data blending feature.
- You can not use the blended data sources in another report. The data only belongs to the report in which it’s created. To use the blended data anyway, you have to copy and paste a component with the blended data into your new report.
- Blending up to 5 data sources in a single chart is allowed.
- Data blending on Data Studio only supports left outer JOIN operations.
Final Thoughts
Data blending helps you make the most of your data and unravel meaningful insights for your business. If you are just starting and want to have first-hand experience and better control over your data, Google Data Studio is a good solution. However, you can always depend on a no-code data pipeline platform like Growth Nirvana, where we will help you to combine data from multiple sources and help you visualize in Data Studio.
The universal dashboard will provide you with a consistent solution to managing data in real-time, without any manual work, ensuring you will have the analysis-ready data for your overview.
Click here for a demo!